Archive for the ‘Corporate IT’ Category
Setting up an internal data analytics practice – some thoughts from a wayfarer
Introduction
This year has been hugely exciting so far: I’ve been exploring and playing with various techniques that fall under the general categories of data mining and text analytics. What’s been particularly satisfying is that I’ve been fortunate to find meaningful applications for these techniques within my organization.
Although I have a fair way to travel yet, I’ve learnt that common wisdom about data analytics – especially the stuff that comes from software vendors and high-end consultancies – can be misleading, even plain wrong. Hence this post in which I dispatch some myths and share a few pointers on establishing data analytics capabilities within an organization.
Busting a few myths
Let’s get right to it by taking a critical look at a few myths about setting up an internal data analytics practice.
- Requires high-end technology and a big budget: this myth is easy to bust because I can speak from recent experience. No, you do not need cutting-edge technology or an oversized budget. You can get started for with an outlay of 0$ – yes, that’s right, for free! All you need to is the open-source statistical package R (check out this section of my article on text mining for more on installing and using R) and the willingness to roll-up your sleeves and learn (more about this later). No worries if you prefer to stick with familiar tools – you can even begin with Excel.
- Needs specialist skills: another myth floating around is that you need Phd level knowledge in statistics or applied mathematics to do practical work in analytics. Sorry, but that’s plain wrong. You do need a PhD to do research in the analytics and develop your own algorithms, but not if you want to apply algorithms written by others.Yes, you will need to develop an understanding of the algorithms you plan to use, a feel for how they work and the ability to tell whether the results make sense. There are many good resources that can help you develop these skills – see, for example, the outstanding books by James, Witten, Hastie and Tibshirani and Kuhn and Johnson.
- Must have sponsorship from the top: this one is possibly a little more controversial than the previous two. It could be argued that it is impossible to gain buy in for a new capability without sponsorship from top management. However, in my experience, it is OK to start small by finding potential internal “customers” for analytics services through informal conversations with folks in different functions.I started by having informal conversations with managers in two different areas: IT infrastructure and sales / marketing. I picked these two areas because I knew that they had several gigabytes of under-exploited data – a good bit of it unstructured – and a lot of open questions that could potentially be answered (at least partially) via methods of data and text analytics. It turned out I was right. I’m currently doing a number of proofs of concept and small projects in both these areas. So you don’t need sponsorship from the top as long as you can get buy in from people who have problems they believe you can solve. If you deliver, they may even advocate your cause to their managers.
A caveat is in order at this point: my organization is not the same as yours, so you may well need to follow a different path from mine. Nevertheless, I do believe that it is always possible to find a way to start without needing permission or incurring official wrath. In that spirit, I now offer some suggestions to help kick-start your efforts
Getting started
As the truism goes, the hardest part of any new effort is getting started. The first thing to keep in mind is to start small. This is true even if you have official sponsorship and a king-sized budget. It is very tempting to spend a lot of time garnering management support for investing in high-end technology. Don’t do it! Do the following instead:
- Develop an understanding of the problems faced by people you plan to approach: The best way to do this is to talk to analysts or frontline managers. In my case, I was fortunate to have access to some very savvy analysts in IT service management and marketing who gave me a slew of interesting ideas to pursue. A word of advice: it is best not to talk to senior managers until you have a few concrete results that you can quantify in terms of dollar values.
- Invest time and effort in understanding analytics algorithms and gaining practical experience with them: As mentioned earlier, I started with R – and I believe it is the best choice. Not just because it is free but also because there are a host of packages available to tackle just about any analytics problem you might encounter. There are some excellent free resources available to get you started with R (check out this listing on the r-statistics blog, for example).It is important that you start cutting code as you learn. This will help you build a repertoire of techniques and approaches as you progress. If you get stuck when coding, chances are you will find a solution on the wonderful stackoverflow site.
- Evangelise, evangelise, evangelise: You are, in effect, trying to sell an idea to people within your organization. You therefore have to identify people who might be able to help you and then convince them that your idea has merit. The best way to do the latter is to have concrete examples of problems that you have tackled. This is a chicken-and-egg situation in that you can’t have any examples until you gain support. I got support by approaching people I know well. I found that most – no, all – of them were happy to provide me with interesting ideas and access to their data.
- Begin with small (but real) problems: It is important to start with the “low-hanging fruit” – the problems that would take the least effort to solve. However, it is equally important to address real problems, i.e. those that matter to someone.
- Leverage your organisation’s existing data infrastructure: From what I’ve written thus far, I may have given you the impression that the tools of data analytics stand separate from your existing data infrastructure. Nothing could be further from the truth. In reality, I often do the initial work (basic preprocessing and exploratory analysis) using my organisation’s relational database infrastructure. Relational databases have sophisticated analytical extensions to SQL as well as efficient bulk data cleansing and transport facilities. Using these make good sense, particularly if your R installation is on a desktop or laptop computer as it is in my case. Moreover, many enterprise database vendors now offer add-on options that integrate R with their products. This gives you the best of both worlds – relational and analytical capabilities on an enterprise-class platform.
- Build relationships with the data management team: Remember the work you are doing falls under the ambit of the group that is officially responsible for managing data in your organization. It is therefore important that you keep them informed of what you’re doing. Sooner or later your paths will cross, and you want to be sure that there are no nasty surprises (for either side!) at that point. Moreover, if you build connections with them early, you may even find that the data management team supports your efforts.
Having waxed verbose, I should mention that my effort is work in progress and I do not know where it will lead. Nevertheless, I offer these suggestions as a wayfarer who is considerably further down the road from where he started.
Parting thoughts
You may have noticed that I’ve refrained from using the overused and over-hyped term “Big Data” in this piece. This is deliberate. Indeed, the techniques I have been using have nothing to do with the size of the datasets. To be honest, I’ve applied them to datasets ranging from a few thousand to a few hundred thousand records, both of which qualify as Very Small Data in today’s world.
Your vendor will be only too happy to sell you Big Data infrastructure that will set you back a good many dollars. However, the chances are good that you do not need it right now. You’ll be much better off going back to them after you hit the limits of your current data processing infrastructure. Moreover, you’ll also be better informed about your needs then.
You may also be wondering why I haven’t said much about the composition of the analytics team (barring the point about not needing PhD statisticians) and how it should be organized. The reason I haven’t done so is that I believe the right composition and organizational structure will emerge from the initial projects done and feedback received from internal customers. The resulting structure will be better suited to the organization than one that is imposed upfront. Long time readers of this blog might recognize this as a tenet of emergent design.
Finally, I should reiterate that my efforts are still very much in progress and I know not where they will lead. However, even if they go nowhere, I would have learnt something about my organization and picked up a useful, practical skill. And that is good enough for me.
The Risk – a dialogue mapping vignette
Foreword
Last week, my friend Paul Culmsee conducted an internal workshop in my organisation on the theme of collaborative problem solving. Dialogue mapping is one of the tools he introduced during the workshop. This piece, primarily intended as a follow-up for attendees, is an introduction to dialogue mapping via a vignette that illustrates its practice (see this post for another one). I’m publishing it here as I thought it might be useful for those who wish to understand what the technique is about.
Dialogue mapping uses a notation called Issue Based Information System (IBIS), which I have discussed at length in this post. For completeness, I’ll begin with a short introduction to the notation and then move on to the vignette.
—
A crash course in IBIS
The IBIS notation consists of the following three elements:
- Issues(or questions): these are issues that are being debated. Typically, issues are framed as questions on the lines of “What should we do about X?” where X is the issue that is of interest to a group. For example, in the case of a group of executives, X might be rapidly changing market condition whereas in the case of a group of IT people, X could be an ageing system that is hard to replace.
- Ideas(or positions): these are responses to questions. For example, one of the ideas of offered by the IT group above might be to replace the said system with a newer one. Typically the whole set of ideas that respond to an issue in a discussion represents the spectrum of participant perspectives on the issue.
- Arguments: these can be Pros (arguments for) or Cons (arguments against) an issue. The complete set of arguments that respond to an idea represents the multiplicity of viewpoints on it.
Compendium is a freeware tool that can be used to create IBIS maps– it can be downloaded here.
In Compendium, IBIS elements are represented as nodes as shown in Figure 1: issues are represented by blue-green question marks; positions by yellow light bulbs; pros by green + signs and cons by red – signs. Compendium supports a few other node types, but these are not part of the core IBIS notation. Nodes can be linked only in ways specified by the IBIS grammar as I discuss next.

Figure 1: IBIS node types
The IBIS grammar can be summarized in three simple rules:
- Issues can be raised anew or can arise from other issues, positions or arguments. In other words, any IBIS element can be questioned. In Compendium notation: a question node can connect to any other IBIS node.
- Ideas can only respond to questions– i.e. in Compendium “light bulb” nodes can only link to question nodes. The arrow pointing from the idea to the question depicts the “responds to” relationship.
- Arguments can only be associated with ideas– i.e. in Compendium “+” and “–“ nodes can only link to “light bulb” nodes (with arrows pointing to the latter)
The legal links are summarized in Figure 2 below.

Figure 2: Legal links in IBIS
…and that’s pretty much all there is to it.
The interesting (and powerful) aspect of IBIS is that the essence of any debate or discussion can be captured using these three elements. Let me try to convince you of this claim via a vignette from a discussion on risk.
—
The Risk – a Dialogue Mapping vignette
“Morning all,” said Rick, “I know you’re all busy people so I’d like to thank you for taking the time to attend this risk identification session for Project X. The objective is to list the risks that we might encounter on the project and see if we can identify possible mitigation strategies.”
He then asked if there were any questions. The head waggles around the room indicated there were none.
“Good. So here’s what we’ll do,” he continued. “I’d like you all to work in pairs and spend 10 minutes thinking of all possible risks and then another 5 minutes prioritising. Work with the person on your left. You can use the flipcharts in the breakout area at the back if you wish to.”
Twenty minutes later, most people were done and back in their seats.
“OK, it looks as though most people are done…Ah, Joe, Mike have you guys finished?” The two were still working on their flip-chart at the back.
“Yeah, be there in a sec,” replied Mike, as he tore off the flip-chart page.
“Alright,” continued Rick, after everyone had settled in. “What I’m going to do now is ask you all to list your top three risks. I’d also like you tell me why they are significant and your mitigation strategies for them.” He paused for a second and asked, “Everyone OK with that?”
Everyone nodded, except Helen who asked, “isn’t it important that we document the discussion?”
“I’m glad you brought that up. I’ll make notes as we go along, and I’ll do it in a way that everyone can see what I’m writing. I’d like you all to correct me if you feel I haven’t understood what you’re saying. It is important that my notes capture your issues, ideas and arguments accurately.”
Rick turned on the data projector, fired up Compendium and started a new map. “Our aim today is to identify the most significant risks on the project – this is our root question” he said, as he created a question node. “OK, so who would like to start?”

Figure 3: The root question
“Sure,” we’ll start, said Joe easily. “Our top risk is that the schedule is too tight. We’ll hit the deadline only if everything goes well, and everyone knows that they never do.”
“OK,” said Rick, “as he entered Joe and Mike’s risk as an idea connecting to the root question. “You’ve also mentioned a point that supports your contention that this is a significant risk – there is absolutely no buffer.” Rick typed this in as a pro connecting to the risk. He then looked up at Joe and asked, “have I understood you correctly?”
“Yes,” confirmed Joe.

Figure 4: Map in progress
“That’s pretty cool,” said Helen from the other end of the table, “I like the notation, it makes reasoning explicit. Oh, and I have another point in support of Joe and Mike’s risk – the deadline was imposed by management before the project was planned.”
Rick began to enter the point…
“Oooh, I’m not sure we should put that down,” interjected Rob from compliance. “I mean, there’s not much we can do about that can we?”
…Rick finished the point as Rob was speaking.

Figure 5: Two pros for the idea
“I hear you Rob, but I think it is important we capture everything that is said,” said Helen.
“I disagree,” said Rob. “It will only annoy management.”
“Slow down guys,” said Rick, “I’m going to capture Rob’s objection as “this is a management imposed-constraint rather than risk. Are you OK with that, Rob?”
Rob nodded his assent.
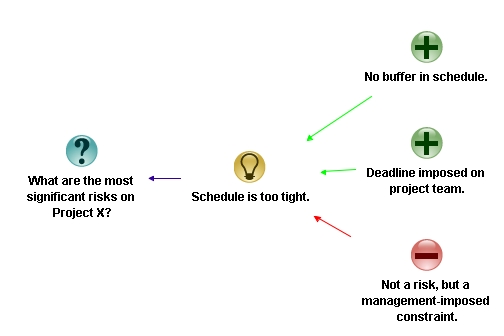
Fig 6: A con enters the picture
I think it is important we articulate what we really think, even if we can’t do anything about it,” continued Rick. There’s no point going through this exercise if we don’t say what we really think. I want to stress this point, so I’m going to add honesty and openness as ground rules for the discussion. Since ground rules apply to the entire discussion, they connect directly to the primary issue being discussed.”

Figure 7: A “criterion” that applies to the analysis of all risks
“OK, so any other points that anyone would like to add to the ones made so far?” Queried Rick as he finished typing.
He looked up. Most of the people seated round the table shook their heads indicating that there weren’t.
“We haven’t spoken about mitigation strategies. Any ideas?” Asked Rick, as he created a question node marked “Mitigation?” connecting to the risk.

Figure 8: Mitigating the risk
“Yeah well, we came up with one,” said Mike. “we think the only way to reduce the time pressure is to cut scope.”
“OK,” said Rick, entering the point as an idea connecting to the “Mitigation?” question. “Did you think about how you are going to do this? He entered the question “How?” connecting to Mike’s point.
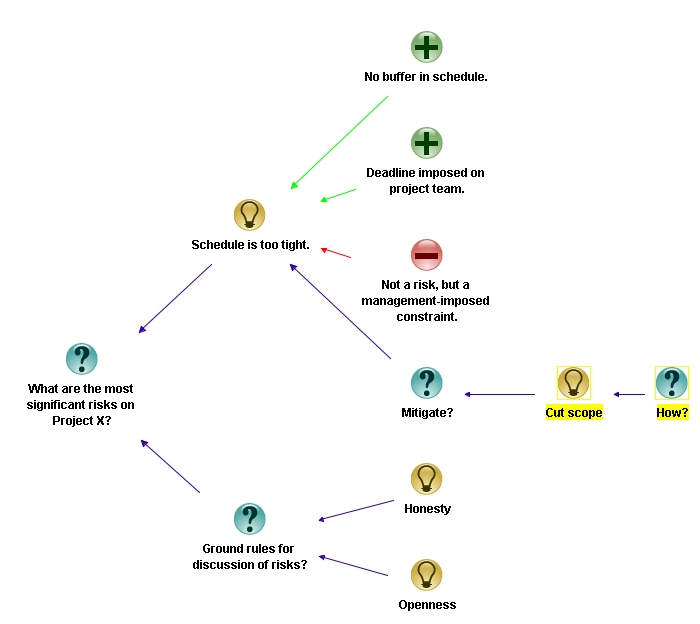
Figure 9: Mitigating the risk
“That’s the problem,” said Joe, “I don’t know how we can convince management to cut scope.”
“Hmmm…I have an idea,” said Helen slowly…
“We’re all ears,” said Rick.
“…Well…you see a large chunk of time has been allocated for building real-time interfaces to assorted systems – HR, ERP etc. I don’t think these need to be real-time – they could be done monthly…and if that’s the case, we could schedule a simple job or even do them manually for the first few months. We can push those interfaces to phase 2 of the project, well into next year.”
There was a silence in the room as everyone pondered this point.
“You know, I think that might actually work, and would give us an extra month…may be even six weeks for the more important upstream stuff,” said Mike. “Great idea, Helen!”
“Can I summarise this point as – identify interfaces that can be delayed to phase 2?” asked Rick, as he began to type it in as a mitigation strategy. “…and if you and Mike are OK with it, I’m going to combine it with the ‘Cut Scope’ idea to save space.”
“Yep, that’s fine,” said Helen. Mike nodded OK.
Rick deleted the “How?” node connecting to the “Cut scope” idea, and edited the latter to capture Helen’s point.

Figure 10: Mitigating the risk
“That’s great in theory, but who is going to talk to the affected departments? They will not be happy.” asserted Rob. One could always count on compliance to throw in a reality check.
“Good point,” said Rick as he typed that in as a con, “and I’ll take the responsibility of speaking to the department heads about this,” he continued entering the idea into the map and marking it as an action point for himself. “Is there anything else that Joe, Mike…or anyone else would like to add here,” he added, as he finished.

Figure 11: Completed discussion of first risk (click to view larger image)
“Nope,” said Mike, “I’m good with that.”
“Yeah me too,” said Helen.
“I don’t have anything else to say about this point,” said Rob, “ but it would be great if you could give us a tutorial on this technique. I think it could be useful to summarise the rationale behind our compliance regulations. Folks have been complaining that they don’t understand the reasoning behind some of our rules and regulations. ”
“I’d be interested in that too,” said Helen, “I could use it to clarify user requirements.”
“I’d be happy to do a session on the IBIS notation and dialogue mapping next week. I’ll check your availability and send an invite out… but for now, let’s focus on the task at hand.”
The discussion continued…but the fly on the wall was no longer there to record it.
—
Afterword
I hope this little vignette illustrates how IBIS and dialogue mapping can aid collaborative decision-making / problem solving by making diverse viewpoints explicit. That said, this is a story, and the problem with stories is that things go the way the author wants them to. In real life, conversations can go off on unexpected tangents, making them really hard to map. So, although it is important to gain expertise in using the software, it is far more important to practice mapping live conversations. The latter is an art that requires considerable practice. I recommend reading Paul Culmsee’s series on the practice of dialogue mapping or <advertisement> Chapter 14 of The Heretic’s Guide to Best Practices</advertisement> for more on this point.
That said, there are many other ways in which IBIS can be used, that do not require as much skill. Some of these include: mapping the central points in written arguments (what’s sometimes called issue mapping) and even decisions on personal matters.
To sum up: IBIS is a powerful means to clarify options and lay them out in an easy-to-follow visual format. Often this is all that is required to catalyse a group decision.
The danger within: internally-generated risks in projects
Introduction
In their book, Waltzing with Bears, Tom DeMarco and Timothy Lister coined the phrase, “risk management is project management for adults”. Twenty years on, it appears that their words have been taken seriously: risk management now occupies a prominent place in BOKs, and has also become a key element of project management practice.
On the other hand, if the evidence is to be believed (as per the oft quoted Chaos Report, for example), IT projects continue to fail at an alarming rate. This is curious because one would have expected that a greater focus on risk management ought to have resulted in better outcomes. So, is it possible at all that risk management (as it is currently preached and practiced in IT project management) cannot address certain risks…or, worse, that there are certain risks are simply not recognized as risks?
Some time ago, I came across a paper by Richard Barber that sheds some light on this very issue. This post elaborates on the nature and importance of such “hidden” risks by drawing on Barber’s work as well as my experiences and those of my colleagues with whom I have discussed the paper.
What are internally generated risks?
The standard approach to risk is based on the occurrence of events. Specifically, risk management is concerned with identifying potential adverse events and taking steps to reduce either their probability of occurrence or their impact. However, as Barber points out, this is a limited view of risk because it overlooks adverse conditions that are built into the project environment. A good example of this is an organizational norm that centralizes decision making at the corporate or managerial level. Such a norm would discourage a project manager from taking appropriate action when confronted with an event that demands an on-the-spot decision. Clearly, it is wrong-headed to attribute the risk to the event because the risk actually has its origins in the norm. In other words, it is an internally generated risk.
(Note: the notion of an internally generated risk is akin to the risk as a pathogen concept that I discussed in this post many years ago.)
Barber defines an internally generated risk as one that has its origin within the project organisation or its host, and arises from [preexisting] rules, policies, processes, structures, actions, decisions, behaviours or cultures. Some other examples of such risks include:
- An overly bureaucratic PMO.
- An organizational culture that discourages collaboration between teams.
- An organizational structure that has multiple reporting lines – this is what I like to call a pseudo-matrix organization 🙂
These factors are similar to those that I described in my post on the systemic causes of project failure. Indeed, I am tempted to call these systemic risks because they are related to the entire system (project + organization). However, that term has already been appropriated by the financial risk community.
Since the term is relatively new, it is important to draw distinctions between internally generated and other types of risks. It is easy to do so because the latter (by definition) have their origins outside the hosting organization. A good example of the latter is the risk of a vendor not delivering a module on time or worse, going into receivership prior to delivering the code.
Finally, there are certain risks that are neither internally generated nor external. For example, using a new technology is inherently risky simply because it is new. Such a risk is inherent rather than internally generated or external.
Understanding the danger within
The author of the paper surveyed nine large projects with the intent of getting some insight into the nature of internally generated risks. The questions he attempted to address are the following:
- How common are these risks?
- How significant are they?
- How well are they managed?
- What is the relationship between the ability of an organization to manage such risks and the organisation’s project management maturity level (i.e. the maturity of its project management processes)
Data was gathered through group workshops and one-on-one interviews in which the author asked a number of questions that were aimed at gaining insight into:
- The key difficulties that project managers encountered on the projects.
- What they perceived to be the main barriers to project success.
The aim of the one-on-one interviews was to allow for a more private setting in which sensitive issues (politics, dysfunctional PMOs and brain-dead rules / norms) could be freely discussed.
The data gathered was studied in detail, with the intent of identifying internally generated risks. The author describes the techniques he used to minimize subjectivity and to ensure that only significant risks were considered. I will omit these details here, and instead focus on his findings as they relate to the questions listed above.
Commonality of internally generated risks
Since organizational rules and norms are often flawed, one might expect that internally generated risks would be fairly common in projects. The author found that this was indeed the case with the projects he surveyed: in his words, the smallest number of non-trivial internally generated risks identified in any of the nine projects was 15, and the highest was 30! Note: the identification of non-trivial risks was done by eliminating those risks that a wide range of stakeholders agreed as being unimportant.
Unfortunately, he does not explicitly list the most common internally-generated risks that he found. However, there are a few that he names later in the article. These are:
- Resource allocation (see my article on the resource allocation syndrome for much more on this)
- Inadequate sponsorship (see my post on the systemic roots of project failure for more on this)
I suspect that experienced project managers would be able to name many more.
Significance of internally generated risks
Determining the significance of these risks is tricky because one has to figure out their probability of occurrence. The impact is much easier to get a handle on, as one has a pretty good idea of the consequences of such risks should they eventuate. (Question: What happens if there is inadequate sponsorship? Answer: the project is highly likely to fail!). The author attempted to get a qualitative handle on the probability of occurrence by asking relevant stakeholders to estimate the likelihood of occurrence. Based on the responses received, he found that a large fraction of the internally-generated risks are significant (high probability of occurrence and high impact).
Management of internally generated risks
To identify whether internally generated risks are well managed, the author asked relevant project teams to look at all the significant internal risks on their project and classify them as to whether or not they had been identified by the project team prior to the research. He found that in over half the cases, less than 50% of the risks had been identified. However, most of the risks that were identified were not managed!
The relationship between project management maturity and susceptibility to internally generated risk
Project management maturity refers to the level of adoption of standard good practices within an organization. Conventional wisdom tells us that there should be an inverse correlation between maturity levels and susceptibility to internally generated risk – the higher the maturity level, the lower the susceptibility.
The author assessed maturity levels by interviewing various stakeholders within the organization and also by comparing the processes used within the organization to well-known standards. The results indicated a weak negative correlation – that is, organisations with a higher level of maturity tended to have a smaller number of internally generated risks. However, as the author admits, one cannot read much into this finding as the correlation was weak.
Discussion
The study suggests that internally generated risks are common and significant on projects. However, the small sample size also suggests that more comprehensive surveys are needed. Nevertheless, anecdotal evidence from colleagues who I spoke with suggests that the findings are reasonably robust. Moreover, it is also clear (both, from the study and my conversations) that these risks are not very well managed. There is a good reason for this: internally generated risks originate in human behavior and / or dysfunctional structures. These tend to be a difficult topic to address in an organizational setting because people are unlikely to tell those above them in the hierarchy that they (the higher ups) are the cause of a problem. A classic example of such a risk is estimation by decree – where a project team is told to just get it done by a certain date. Although most project managers are aware of such risks, they are reluctant to name them for obvious reasons.
Conclusion
I suspect most project managers who work in corporate environments will have had to grapple with internally generated risks in one form or another. Although traditional risk management does not recognize these risks as risks, seasoned project managers know from experience that people, politics or even processes can pose major problems to smooth working of projects. However, even when recognised for what they are, these risks can be hard to tackle because they lie outside a project manager’s sphere of influence. They therefore tend to become those proverbial pachyderms in the room – known to all but never discussed, let alone documented….and therein lies the danger within.


