Archive for the ‘Decision Making’ Category
The dark side of data science
Data scientists are sometimes blind to the possibility that the predictions of their algorithms can have unforeseen negative effects on people. Ethical or social implications are easy to overlook when one finds interesting new patterns in data, especially if they promise significant financial gains. The Centrelink debt recovery debacle, recently reported in the Australian media, is a case in point.
Here is the story in brief:
Centrelink is an Australian Government organisation responsible for administering welfare services and payments to those in need. A major challenge such organisations face is ensuring that their clients are paid no less and no more than what is due to them. This is difficult because it involves crosschecking client income details across multiple systems owned by different government departments, a process that necessarily involves many assumptions. In July 2016, Centrelink unveiled an automated compliance system that compares income self-reported by clients to information held by the taxation office.
The problem is that the algorithm is flawed: it makes strong (and incorrect!) assumptions regarding the distribution of income across a financial year and, as a consequence, unfairly penalizes a number of legitimate benefit recipients. It is very likely that the designers and implementers of the algorithm did not fully understand the implications of their assumptions. Worse, from the errors made by the system, it appears they may not have adequately tested it either. But this did not stop them (or, quite possibly, their managers) from unleashing their algorithm on an unsuspecting public, causing widespread stress and distress. More on this a bit later.
Algorithms like the one described above are the subject of Cathy O’Neil’s aptly titled book, Weapons of Math Destruction. In the remainder of this article I discuss the main themes of the book. Just to be clear, this post is more riff than review. However, for those seeking an opinion, here’s my one-line version: I think the book should be read not only by data science practitioners, but also by those who use or are affected by their algorithms (which means pretty much everyone!).
Abstractions and assumptions
‘O Neil begins with the observation that data algorithms are mathematical models of reality, and are necessarily incomplete because several simplifying assumptions are invariably baked into them. This point is important and often overlooked so it is worth illustrating via an example.
When assessing a person’s suitability for a loan, a bank will want to know whether the person is a good risk. It is impossible to model creditworthiness completely because we do not know all the relevant variables and those that are known may be hard to measure. To make up for their ignorance, data scientists typically use proxy variables, i.e. variables that are believed to be correlated with the variable of interest and are also easily measurable. In the case of creditworthiness, proxy variables might be things like gender, age, employment status, residential postcode etc. Unfortunately many of these can be misleading, discriminatory or worse, both.
The Centrelink algorithm provides a good example of such a “double-whammy” proxy. The key variable it uses is the difference between the client’s annual income reported by the taxation office and self-reported annual income stated by the client. A large difference is taken to be an indicative of an incorrect payment and hence an outstanding debt. This simplistic assumption overlooks the fact that most affected people are not in steady jobs and therefore do not earn regular incomes over the course of a financial year (see this article by Michael Griffin, for a detailed example). Worse, this crude proxy places an unfair burden on vulnerable individuals for whom casual and part time work is a fact of life.
Worse still, for those wrongly targeted with a recovery notice, getting the errors sorted out is not a straightforward process. This is typical of a WMD. As ‘O Neil states in her book, “The human victims of WMDs…are held to a far higher standard of evidence than the algorithms themselves.” Perhaps this is because the algorithms are often opaque. But that’s a poor excuse. This is the only technical field where practitioners are held to a lower standard of accountability than those affected by their products.
‘O Neil’s sums it up rather nicely when she calls algorithms like the Centrelink one weapons of math destruction (WMD).
Self-fulfilling prophecies and feedback loops
A characteristic of WMD is that their predictions often become self-fulfilling prophecies. For example a person denied a loan by a faulty risk model is more likely to be denied again when he or she applies elsewhere, simply because it is on their record that they have been refused credit before. This kind of destructive feedback loop is typical of a WMD.
An example that ‘O Neil dwells on at length is a popular predictive policing program. Designed for efficiency rather than nuanced judgment, such algorithms measure what can easily be measured and act by it, ignoring the subtle contextual factors that inform the actions of experienced officers on the beat. Worse, they can lead to actions that can exacerbate the problem. For example, targeting young people of a certain demographic for stop and frisk actions can alienate them to a point where they might well turn to crime out of anger and exasperation.
As Goldratt famously said, “Tell me how you measure me and I’ll tell you how I’ll behave.”
This is not news: savvy managers have known about the dangers of managing by metrics for years. The problem is now exacerbated manyfold by our ability to implement and act on such metrics on an industrial scale, a trend that leads to a dangerous devaluation of human judgement in areas where it is most needed.
A related problem – briefly mentioned earlier – is that some of the important variables are known but hard to quantify in algorithmic terms. For example, it is known that community-oriented policing, where officers on the beat develop relationships with people in the community, leads to greater trust. The degree of trust is hard to quantify, but it is known that communities that have strong relationships with their police departments tend to have lower crime rates than similar communities that do not. Such important but hard-to-quantify factors are typically missed by predictive policing programs.
Blackballed!
Ironically, although WMDs can cause destructive feedback loops, they are often not subjected to feedback themselves. O’Neil gives the example of algorithms that gauge the suitability of potential hires. These programs often use proxy variables such as IQ test results, personality tests etc. to predict employability. Candidates who are rejected often do not realise that they have been screened out by an algorithm. Further, it often happens that candidates who are thus rejected go on to successful careers elsewhere. However, this post-rejection information is never fed back to the algorithm because it impossible to do so.
In such cases, the only way to avoid being blackballed is to understand the rules set by the algorithm and play according to them. As ‘O Neil so poignantly puts it, “our lives increasingly depend on our ability to make our case to machines.” However, this can be difficult because it assumes that a) people know they are being assessed by an algorithm and 2) they have knowledge of how the algorithm works. In most hiring scenarios neither of these hold.
Just to be clear, not all data science models ignore feedback. For example, sabermetric algorithms used to assess player performance in Major League Baseball are continually revised based on latest player stats, thereby taking into account changes in performance.
Driven by data
In recent years, many workplaces have gradually seen the introduction to data-driven efficiency initiatives. Automated rostering, based on scheduling algorithms is an example. These algorithms are based on operations research techniques that were developed for scheduling complex manufacturing processes. Although appropriate for driving efficiency in manufacturing, these techniques are inappropriate for optimising shift work because of the effect they have on people. As O’ Neil states:
Scheduling software can be seen as an extension of just-in-time economy. But instead of lawn mower blades or cell phone screens showing up right on cue, it’s people, usually people who badly need money. And because they need money so desperately, the companies can bend their lives to the dictates of a mathematical model.
She correctly observes that an, “oversupply of low wage labour is the problem.” Employers know they can get away with treating people like machine parts because they have a large captive workforce. What makes this seriously scary is that vested interests can make it difficult to outlaw such exploitative practices. As ‘O Neil mentions:
Following [a] New York Times report on Starbucks’ scheduling practices, Democrats in Congress promptly drew up bills to rein in scheduling software. But facing a Republican majority fiercely opposed to government regulations, the chances that their bill would become law were nil. The legislation died.
Commercial interests invariably trump social and ethical issues, so it is highly unlikely that industry or government will take steps to curb the worst excesses of such algorithms without significant pressure from the general public. A first step towards this is to educate ourselves on how these algorithms work and the downstream social effects of their predictions.
Messing with your mind
There is an even more insidious way that algorithms mess with us. Hot on the heels of the recent US presidential election, there were suggestions that fake news items on Facebook may have influenced the results. Mark Zuckerberg denied this, but as this Casey Newton noted in this trenchant tweet, the denial leaves Facebook in “the awkward position of having to explain why they think they drive purchase decisions but not voting decisions.”
Be that as it may, the fact is Facebook’s own researchers have been conducting experiments to fine tune a tool they call the “voter megaphone”. Here’s what ‘O Neil says about it:
The idea was to encourage people to spread the word that they had voted. This seemed reasonable enough. By sprinkling people’s news feeds with “I voted” updates, Facebook was encouraging Americans – more that sixty-one million of them – to carry out their civic duty….by posting about people’s voting behaviour, the site was stoking peer pressure to vote. Studies have shown that the quiet satisfaction of carrying out a civic duty is less likely to move people than the possible judgement of friends and neighbours…The Facebook started out with a constructive and seemingly innocent goal to encourage people to vote. And it succeeded…researchers estimated that their campaign had increased turnout by 340,000 people. That’s a big enough crowd to swing entire states, and even national elections.
And if that’s not scary enough, try this:
For three months leading up to the election between President Obama and Mitt Romney, a researcher at the company….altered the news feed algorithm for about two million people, all of them politically engaged. The people got a higher proportion of hard news, as opposed to the usual cat videos, graduation announcements, or photos from Disney world….[the researcher] wanted to see if getting more [political] news from friends changed people’s political behaviour. Following the election [he] sent out surveys. The self-reported results that voter participation in this group inched up from 64 to 67 percent.
This might not sound like much, but considering the thin margins of recent presidential elections, it could be enough to change a result.
But it’s even more insidious. In a paper published in 2014, Facebook researchers showed that users’ moods can be influenced by the emotional content of their newsfeeds. Here’s a snippet from the abstract of the paper:
In an experiment with people who use Facebook, we test whether emotional contagion occurs outside of in-person interaction between individuals by reducing the amount of emotional content in the News Feed. When positive expressions were reduced, people produced fewer positive posts and more negative posts; when negative expressions were reduced, the opposite pattern occurred. These results indicate that emotions expressed by others on Facebook influence our own emotions, constituting experimental evidence for massive-scale contagion via social networks.
As you might imagine, there was a media uproar following which the lead researcher issued a clarification and Facebook officials duly expressed regret (but, as far as I know, not an apology). To be sure, advertisers have been exploiting this kind of “mind control” for years, but a public social media platform should (expect to) be held to a higher standard of ethics. Facebook has since reviewed its internal research practices, but the recent fake news affair shows that the story is to be continued.
Disarming weapons of math destruction
The Centrelink debt debacle, Facebook mood contagion experiments and the other case studies mentioned in the book illusrate the myriad ways in which Big Data algorithms have a pernicious effect on our day-to-day lives. Quite often people remain unaware of their influence, wondering why a loan was denied or a job application didn’t go their way. Just as often, they are aware of what is happening, but are powerless to change it – shift scheduling algorithms being a case in point.
This is not how it was meant to be. Technology was supposed to make life better for all, not just the few who wield it.
So what can be done? Here are some suggestions:
- To begin with, education is the key. We must work to demystify data science, create a general awareness of data science algorithms and how they work. O’ Neil’s book is an excellent first step in this direction (although it is very thin on details of how the algorithms work)
- Develop a code of ethics for data science practitioners. It is heartening to see that IEEE has recently come up with a discussion paper on ethical considerations for artificial intelligence and autonomous systems and ACM has proposed a set of principles for algorithmic transparency and accountability. However, I should also tag this suggestion with the warning that codes of ethics are not very effective as they can be easily violated. One has to – somehow – embed ethics in the DNA of data scientists. I believe, one way to do this is through practice-oriented education in which data scientists-in-training grapple with ethical issues through data challenges and hackathons. It is as Wittgenstein famously said, “it is clear that ethics cannot be articulated.” Ethics must be practiced.
- Put in place a system of reliable algorithmic audits within data science departments, particularly those that do work with significant social impact.
- Increase transparency a) by publishing information on how algorithms predict what they predict and b) by making it possible for those affected by the algorithm to access the data used to classify them as well as their classification, how it will be used and by whom.
- Encourage the development of algorithms that detect bias in other algorithms and correct it.
- Inspire aspiring data scientists to build models for the good.
It is only right that the last word in this long riff should go to ‘O Neil whose work inspired it. Towards the end of her book she writes:
Big Data processes codify the past. They do not invent the future. Doing that requires moral imagination, and that’s something that only humans can provide. We have to explicitly embed better values into our algorithms, creating Big Data models that follow our ethical lead. Sometimes that will mean putting fairness ahead of profit.
Excellent words for data scientists to live by.
Improving decision-making in projects
An irony of organisational life is that the most important decisions on projects (or any other initiatives) have to be made at the start, when ambiguity is at its highest and information availability lowest. I recently gave a talk at the Pune office of BMC Software on improving decision-making in such situations.
The talk was recorded and simulcast to a couple of locations in India. The folks at BMC very kindly sent me a copy of the recording with permission to publish it on Eight to Late. Here it is:
Based on the questions asked and the feedback received, I reckon that a number of people found the talk useful. I’d welcome your comments/feedback.
Acknowledgements: My thanks go out to Gaurav Pal, Manish Gadgil and Mrinalini Wankhede for giving me the opportunity to speak at BMC, and to Shubhangi Apte for putting me in touch with them. Finally, I’d like to thank the wonderful audience at BMC for their insightful questions and comments.
The Risk – a dialogue mapping vignette
Foreword
Last week, my friend Paul Culmsee conducted an internal workshop in my organisation on the theme of collaborative problem solving. Dialogue mapping is one of the tools he introduced during the workshop. This piece, primarily intended as a follow-up for attendees, is an introduction to dialogue mapping via a vignette that illustrates its practice (see this post for another one). I’m publishing it here as I thought it might be useful for those who wish to understand what the technique is about.
Dialogue mapping uses a notation called Issue Based Information System (IBIS), which I have discussed at length in this post. For completeness, I’ll begin with a short introduction to the notation and then move on to the vignette.
—
A crash course in IBIS
The IBIS notation consists of the following three elements:
- Issues(or questions): these are issues that are being debated. Typically, issues are framed as questions on the lines of “What should we do about X?” where X is the issue that is of interest to a group. For example, in the case of a group of executives, X might be rapidly changing market condition whereas in the case of a group of IT people, X could be an ageing system that is hard to replace.
- Ideas(or positions): these are responses to questions. For example, one of the ideas of offered by the IT group above might be to replace the said system with a newer one. Typically the whole set of ideas that respond to an issue in a discussion represents the spectrum of participant perspectives on the issue.
- Arguments: these can be Pros (arguments for) or Cons (arguments against) an issue. The complete set of arguments that respond to an idea represents the multiplicity of viewpoints on it.
Compendium is a freeware tool that can be used to create IBIS maps– it can be downloaded here.
In Compendium, IBIS elements are represented as nodes as shown in Figure 1: issues are represented by blue-green question marks; positions by yellow light bulbs; pros by green + signs and cons by red – signs. Compendium supports a few other node types, but these are not part of the core IBIS notation. Nodes can be linked only in ways specified by the IBIS grammar as I discuss next.

Figure 1: IBIS node types
The IBIS grammar can be summarized in three simple rules:
- Issues can be raised anew or can arise from other issues, positions or arguments. In other words, any IBIS element can be questioned. In Compendium notation: a question node can connect to any other IBIS node.
- Ideas can only respond to questions– i.e. in Compendium “light bulb” nodes can only link to question nodes. The arrow pointing from the idea to the question depicts the “responds to” relationship.
- Arguments can only be associated with ideas– i.e. in Compendium “+” and “–“ nodes can only link to “light bulb” nodes (with arrows pointing to the latter)
The legal links are summarized in Figure 2 below.

Figure 2: Legal links in IBIS
…and that’s pretty much all there is to it.
The interesting (and powerful) aspect of IBIS is that the essence of any debate or discussion can be captured using these three elements. Let me try to convince you of this claim via a vignette from a discussion on risk.
—
The Risk – a Dialogue Mapping vignette
“Morning all,” said Rick, “I know you’re all busy people so I’d like to thank you for taking the time to attend this risk identification session for Project X. The objective is to list the risks that we might encounter on the project and see if we can identify possible mitigation strategies.”
He then asked if there were any questions. The head waggles around the room indicated there were none.
“Good. So here’s what we’ll do,” he continued. “I’d like you all to work in pairs and spend 10 minutes thinking of all possible risks and then another 5 minutes prioritising. Work with the person on your left. You can use the flipcharts in the breakout area at the back if you wish to.”
Twenty minutes later, most people were done and back in their seats.
“OK, it looks as though most people are done…Ah, Joe, Mike have you guys finished?” The two were still working on their flip-chart at the back.
“Yeah, be there in a sec,” replied Mike, as he tore off the flip-chart page.
“Alright,” continued Rick, after everyone had settled in. “What I’m going to do now is ask you all to list your top three risks. I’d also like you tell me why they are significant and your mitigation strategies for them.” He paused for a second and asked, “Everyone OK with that?”
Everyone nodded, except Helen who asked, “isn’t it important that we document the discussion?”
“I’m glad you brought that up. I’ll make notes as we go along, and I’ll do it in a way that everyone can see what I’m writing. I’d like you all to correct me if you feel I haven’t understood what you’re saying. It is important that my notes capture your issues, ideas and arguments accurately.”
Rick turned on the data projector, fired up Compendium and started a new map. “Our aim today is to identify the most significant risks on the project – this is our root question” he said, as he created a question node. “OK, so who would like to start?”

Figure 3: The root question
“Sure,” we’ll start, said Joe easily. “Our top risk is that the schedule is too tight. We’ll hit the deadline only if everything goes well, and everyone knows that they never do.”
“OK,” said Rick, “as he entered Joe and Mike’s risk as an idea connecting to the root question. “You’ve also mentioned a point that supports your contention that this is a significant risk – there is absolutely no buffer.” Rick typed this in as a pro connecting to the risk. He then looked up at Joe and asked, “have I understood you correctly?”
“Yes,” confirmed Joe.
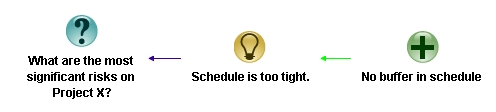
Figure 4: Map in progress
“That’s pretty cool,” said Helen from the other end of the table, “I like the notation, it makes reasoning explicit. Oh, and I have another point in support of Joe and Mike’s risk – the deadline was imposed by management before the project was planned.”
Rick began to enter the point…
“Oooh, I’m not sure we should put that down,” interjected Rob from compliance. “I mean, there’s not much we can do about that can we?”
…Rick finished the point as Rob was speaking.

Figure 5: Two pros for the idea
“I hear you Rob, but I think it is important we capture everything that is said,” said Helen.
“I disagree,” said Rob. “It will only annoy management.”
“Slow down guys,” said Rick, “I’m going to capture Rob’s objection as “this is a management imposed-constraint rather than risk. Are you OK with that, Rob?”
Rob nodded his assent.
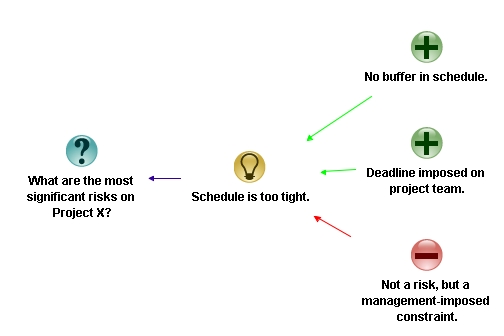
Fig 6: A con enters the picture
I think it is important we articulate what we really think, even if we can’t do anything about it,” continued Rick. There’s no point going through this exercise if we don’t say what we really think. I want to stress this point, so I’m going to add honesty and openness as ground rules for the discussion. Since ground rules apply to the entire discussion, they connect directly to the primary issue being discussed.”

Figure 7: A “criterion” that applies to the analysis of all risks
“OK, so any other points that anyone would like to add to the ones made so far?” Queried Rick as he finished typing.
He looked up. Most of the people seated round the table shook their heads indicating that there weren’t.
“We haven’t spoken about mitigation strategies. Any ideas?” Asked Rick, as he created a question node marked “Mitigation?” connecting to the risk.

Figure 8: Mitigating the risk
“Yeah well, we came up with one,” said Mike. “we think the only way to reduce the time pressure is to cut scope.”
“OK,” said Rick, entering the point as an idea connecting to the “Mitigation?” question. “Did you think about how you are going to do this? He entered the question “How?” connecting to Mike’s point.
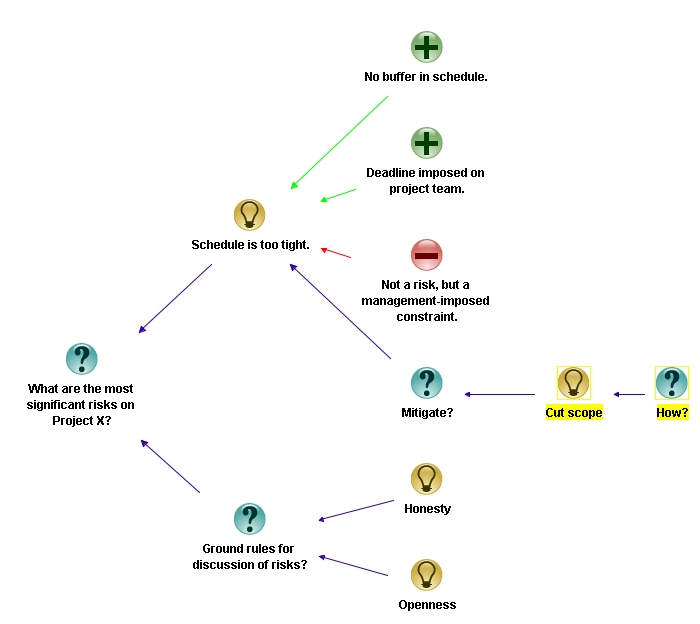
Figure 9: Mitigating the risk
“That’s the problem,” said Joe, “I don’t know how we can convince management to cut scope.”
“Hmmm…I have an idea,” said Helen slowly…
“We’re all ears,” said Rick.
“…Well…you see a large chunk of time has been allocated for building real-time interfaces to assorted systems – HR, ERP etc. I don’t think these need to be real-time – they could be done monthly…and if that’s the case, we could schedule a simple job or even do them manually for the first few months. We can push those interfaces to phase 2 of the project, well into next year.”
There was a silence in the room as everyone pondered this point.
“You know, I think that might actually work, and would give us an extra month…may be even six weeks for the more important upstream stuff,” said Mike. “Great idea, Helen!”
“Can I summarise this point as – identify interfaces that can be delayed to phase 2?” asked Rick, as he began to type it in as a mitigation strategy. “…and if you and Mike are OK with it, I’m going to combine it with the ‘Cut Scope’ idea to save space.”
“Yep, that’s fine,” said Helen. Mike nodded OK.
Rick deleted the “How?” node connecting to the “Cut scope” idea, and edited the latter to capture Helen’s point.

Figure 10: Mitigating the risk
“That’s great in theory, but who is going to talk to the affected departments? They will not be happy.” asserted Rob. One could always count on compliance to throw in a reality check.
“Good point,” said Rick as he typed that in as a con, “and I’ll take the responsibility of speaking to the department heads about this,” he continued entering the idea into the map and marking it as an action point for himself. “Is there anything else that Joe, Mike…or anyone else would like to add here,” he added, as he finished.

Figure 11: Completed discussion of first risk (click to view larger image)
“Nope,” said Mike, “I’m good with that.”
“Yeah me too,” said Helen.
“I don’t have anything else to say about this point,” said Rob, “ but it would be great if you could give us a tutorial on this technique. I think it could be useful to summarise the rationale behind our compliance regulations. Folks have been complaining that they don’t understand the reasoning behind some of our rules and regulations. ”
“I’d be interested in that too,” said Helen, “I could use it to clarify user requirements.”
“I’d be happy to do a session on the IBIS notation and dialogue mapping next week. I’ll check your availability and send an invite out… but for now, let’s focus on the task at hand.”
The discussion continued…but the fly on the wall was no longer there to record it.
—
Afterword
I hope this little vignette illustrates how IBIS and dialogue mapping can aid collaborative decision-making / problem solving by making diverse viewpoints explicit. That said, this is a story, and the problem with stories is that things go the way the author wants them to. In real life, conversations can go off on unexpected tangents, making them really hard to map. So, although it is important to gain expertise in using the software, it is far more important to practice mapping live conversations. The latter is an art that requires considerable practice. I recommend reading Paul Culmsee’s series on the practice of dialogue mapping or <advertisement> Chapter 14 of The Heretic’s Guide to Best Practices</advertisement> for more on this point.
That said, there are many other ways in which IBIS can be used, that do not require as much skill. Some of these include: mapping the central points in written arguments (what’s sometimes called issue mapping) and even decisions on personal matters.
To sum up: IBIS is a powerful means to clarify options and lay them out in an easy-to-follow visual format. Often this is all that is required to catalyse a group decision.


