Archive for the ‘Project Management’ Category
Monte Carlo simulation of risk and uncertainty in project tasks
Introduction
When developing duration estimates for a project task, it is useful to make a distinction between the uncertainty inherent in the task and uncertainty due to known risks. The former is uncertainty due to factors that are not known whereas the latter corresponds uncertainty due to events that are known, but may or may not occur. In this post, I illustrate how the two types of uncertainty can be combined via Monte Carlo simulation. Readers may find it helpful to keep my introduction to Monte Carlo simulations of project tasks handy, as I refer to it extensively in the present piece.
Setting the stage
Let’s assume that there’s a task that needs doing, and the person who is going to do it reckons it will take between 2 and 8 hours to complete it, with a most likely completion time of 4 hours. How the estimator comes up with these numbers isn’t important here – maybe there’s some guesswork, maybe some padding or maybe it is really based on experience (as it should be). For simplicity we’ll assume the probability distribution for the task duration is triangular. It is not hard to show that, given the above mentioned estimates, the probability, 

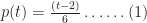

And,
These two expressions are sometimes referred to as the probability distribution function (PDF). The PDF described by equations (1) and (2) is illustrated in Figure 1. (Note: Please click on the Figures to view full-size images)

Figure 1: Probability distribution for task
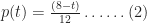
Now, a PDF tells us the probability that the task will finish at a particular time 


and,

For a detailed derivation, please see my introductory post. The CDF for the distribution is shown in Figure 2.

Figure 2: CDF for task
Now for the complicating factor: let us assume there is a risk that has a bearing on this task. The risk could be any known factor that has a negative impact on task duration. For example, it could be that a required resource is delayed or that the deliverable will fails a quality check and needs rework. The consequence of the risk – should it eventuate – is that the task takes longer. How much longer the task takes depends on specifics of the risk. For the purpose of this example we’ll assume that the additional time taken is also described by a triangular distribution with a minimum, most likely and maximum time of 1, 2 and 3 hrs respectively. The PDF 

And

The figure for this distribution is shown in Figure 3.

Figure 3: Probability distribution of additional time due to risk
The CDF for the additional time taken if the risk eventuates (which we’ll denote by 

and,
The CDF for the risk consequence is shown in Figure 4.

Figure 4: CDF of additional time due to risk
Before proceeding with the simulation it is worth clarifying what all this means, and what we want to do with it.
Firstly, equations 1-4 describe the inherent uncertainty associated with the task while equations 5 through 8 describe the consequences of the risk, if it eventuates.
Secondly, we have described the task and the risk separately. In reality, we need a unified description of the two – a combined distribution function for the uncertainty associated with the task and the risk taken together. This is what the simulation will give us.
Finally, one thing I have not yet specified is the probabilty that the risk will actually occur. Clearly, the higher the probability, the greater the potential delay. Below I carry out simulations for risk probabilities of varying from 0.1 to 0.5.
That completes the specification of the problem – let’s move on to the simulation.
The simulation
The simulation procedure I used for the zero-risk case (i.e. the task described by equations 1 and 2 ) is as follows :
- Generate a random number between 0 and 1. Treat this number as the cumulative probability,
- Find the time,
- Repeat steps (1) and (2) for a sufficiently large number of trials.
The frequency distribution of completion times for the task, based on 30,000 trials is shown in Figure 5.

Figure 5: Simulation histogram for zero-risk case
As we might expect, Figure 5 can be translated to the probability distribution shown in Figure 1 by a straightforward normalization – i.e. by dividing each bar by the total number of trials.
What remains to be done is to incorporate the risk (as modeled in equations 5-6) into the simulation. To simulate the task with the risk, we simply do the following for each trial:
- Simulate the task without the risk as described earlier.
- Generate another random number between 0 and 1.
- If the random number is less than the probability of the risk, then simulate the risk. Note that since the risk is described by a triangular function, the procedure to simulate it is the same as that for the task (albeit with different parameters).
- If the random number is greater than the probability of the risk, do nothing.
- Add the results of 1 and 4. This is the outcome of the trial.
- Repeat steps 1-5 for as many trials as required.
I performed simulations for the task with risk probabilities of 10%, 30% and 50%. The frequency distributions of completion times for these are displayed in Figures 6-8 (in increasing order of probability). As one would expect, the spread of times increases with increasing probability. Further, the distribution takes on a distinct second peak as the probability increases: the first peak is at 


Figure 6: Simulation histogram (10% probability of risk)

Figure 7: Simulation histogram (30% probability of risk)

Figure 8: Frequency histogram (50% probability of risk)
It is also instructive to compare average completion times for the four cases (zero-risk and 10%, 30% and 50%). The average can computed from the simulation by simply adding up the simulated completion times (for all trials) and dividing by the total number of simulation trials (30,000 in our case). On doing this, I get the following:
Average completion time for zero-risk case = 4.66 hr
Average completion time with 10% probability of risk = 4.89 hrs
Average completion time with 30% probability of risk = 5.36 hrs
Average completion time with 50% probability of risk= 5.83 hrs
No surprises here.
One point to note is that the result obtained from the simulation for the zero-risk case compares well with the exact formula for a triangular distribution (see the Wikipedia article for the triangular distribution):

This serves as a sanity check on the simulation procedure.
It is also interesting to compare the cumulative probabilities of completion in the zero-risk and high risk (50% probability) case. The CDFs for the two are shown in Figure 9. The co-plotted CDFs allow for a quick comparison of completion time predictions. For example, in the zero-risk case, there is about a 90% chance that the task will be completed in a little over 6 hrs whereas when the probability of the risk is 50%, the 90% completion time increases to 8 hrs (see Figure 9).

Figure 9: CDFs for zero risk and 50% probability of risk cases
Next steps and wrap up
For those who want to learn more about simulating project uncertainty and risk, I can recommend the UK MOD paper – Three Point Estimates And Quantitative Risk Analysis A Process Guide For Risk Practitioners. The paper provides useful advice on how three point estimates for project variables should be constructed. It also has a good discussion of risk and how it should be combined with the inherent uncertainty associated with a variable. Indeed, the example I have described above was inspired by the paper’s discussion of uncertainty and risk.
Of course, as with any quantitative predictions of project variables, the numbers are only as reliable as the assumptions that go into them, the main assumption here being the three point estimates that were used to derive the distributions for the task uncertainty and risk (equations 1-2 and 5-6). Typically these are obtained from historical data. However, there are well known problems associated with history-based estimates. For one, as we can never be sure that the historical tasks are similar to the one at hand in ways that matter (this is the reference class problem). As Shim Marom warns us in this post, all our predictions depend on the credibility of our estimates. Quoting from his post:
Can you get credible three point estimates? Do you have access to credible historical data to support that? Do you have access to Subject Matter Experts (SMEs) who can assist in getting these credible estimates?
If not, don’t bother using Monte Carlo.
In closing, I hope my readers will find this simple example useful in understanding how uncertainty and risk can be accounted for using Monte Carlo simulations. In the end, though, one should always keep in mind that the use of sophisticated techniques does not magically render one immune to the GIGO principle.
Elephants in the room: seven reasons why project risks are ignored
Project managers know from experience that projects can go wrong because of events that weren’t foreseen. Some of these may be unforeseeable– that is, they could not have been anticipated given what was known prior to their occurrence. On the other hand it is surprisingly common that known risks are ignored. The metaphor of the elephant in the room is appropriate here because these risks are quite obvious to outsiders, but apparently not to those involved in the project. This is a strange state of affairs because:
- Those involved in the project are best placed to “see the elephant”
- They are directly affected when the elephant goes on rampage – i.e. the risk eventuates.
This post discusses reasons why these metaphorical pachyderms are ignored by those who need most to recognize their existence .
Let’s get right into it then – seven reasons why risks are ignored on projects:
1. Let sleeping elephants lie: This is a situation in which stakeholders are aware of the risk, but don’t do anything about it in the hope that it will not eventuate. Consequently, they have no idea how to handle it if it does. Unfortunately, as Murphy assures us, sleeping elephants will wake at the most inconvenient moment.
2. It’s not my elephant: This is a situation where no one is willing to take responsibility for managing the risk. This game of “pass the elephant” is resolved by handing charge of the elephant to a reluctant mahout.
3. Deny the elephant’s existence: This often manifests itself as a case of collective (and wilful) blindness to obvious risks. No one acknowledges the risk, perhaps out of fear of that they will be handed responsibility for it (see point 2 above).
4. The elephant has powerful friends: This is a pathological situation where some stakeholders (often those with clout) actually increase the likelihood of a risk through bad decisions. A common example of this is the imposition of arbitrary deadlines, based on fantasy rather than fact.
5. The elephant might get up and walk away: This is wishful thinking, where the team assumes that the risk will magically disappear. This is the “hope and pray” method of risk management, quite common in some circles.
6. The elephant’s not an elephant: This is a situation where a risk is mistaken for an opportunity. Yes, this does happen. An example is when a new technology is used on a project: some team members may see it as an opportunity, but in reality it may pose a risk.
7. The elephant’s dead: This is exemplified by the response, “that is no longer a problem,” when asked about the status of a risk. The danger in these situations is that the elephant may only be fast asleep, not dead.
Risks that are ignored are the metaphorical pachyderms in the room. Ignoring them is easy because it involves no effort whatsoever. However, it is a strategy that is fraught with danger because once these risks eventuate, they can – like those apparently invisible elephants – run amok and wreak havoc on projects.

(Image courtesy John Atkinson: https://wronghands1.com/2018/01/12/parts-of-the-elephant-in-the-room/)
There’s trouble ahead: early warning signs of project failure
Introduction
I’ve written a number of articles on project failure, covering topics ranging from definitions of success to the role of biases in project failure. As interesting as these issues are, they are somewhat removed from the day-to-day concerns of a project manager who is more interested in avoiding failure than defining or analyzing it. In a paper entitled, Early warning signs of IT project failure: the dominant dozen, Leon Kappelman et. al. outline the top twelve risks associated with IT project failures. This post summarises the paper and lists the top twelve signs of impending trouble on projects.
Background and research methodology
The authors focus on early warning signs – i.e. those that occur within the initial 20% of the planned schedule. Further, to ensure comprehensive coverage of risks, their conclusions are based on inputs from academic and industry journals as well as from experienced IT project managers. The paper provides a detailed explanation of their research methodology, which I’ll quote directly from the paper:
The research team first searched the literature extensively to develop a preliminary list of early warning signs (EWSs). The two authors experienced in IT project management then added several EWSs based on their personal experience. Next, 19 IT project management experts were asked to assess the list. On the basis of their feedback, we added new items and modified others to develop a list of 53 EWSs. Finally, the research team invited 138 experienced IT project managers (including the original 19 experts) to participate in rating the 53 EWSs using a scale from 1 (extremely unimportant) to 7 (extremely important). Fifty-five (55) of these managers completed the survey, yielding a response rate of nearly 40 percent. The respondents had an average of more than 15 years of IT project management experience. The budgets of the largest IT projects they managed ranged from 3 million to 7 billion dollars. About 30 percent held the title of program or project manager and nearly 20 percent had consultant titles. Director or program analyst titles accounted for about 15 percent each, 10 percent were vice presidents, and the rest held titles such as CEO, CIO, chief scientist, chief technologist, or partner.
Although the list and the rankings were based on the subjective opinions of experts, the large number of participants ensures a degree of consensus regarding the most important factors.
The troublesome twelve
After ranking the fifty odd risks, the authors focused on those that had scores above 6 (out of a maximum possible of 7 as discussed above). There were 17 risks that satisfied this (somewhat arbitrary) criterion. Some of these were similar, so they could be combined. For example, the four risks:
- No documented milestone deliverables and due dates.
- No project status progress process
- Schedule deadline not reconciled to the project schedule
- Early project delays are ignored — no revision to the overall project schedule
were combined into: ineffective schedule planning and/or management.
This process of combining the top 17 items resulted in twelve risks, half of which turned out to be people-related and the other half process-related. I discuss each of the risks in detail below.
People-related early warning signs
1. Lack of top management support: This was the number one risk out of the fifty three that the authors listed. This isn’t surprising – a project that lacks executive support is unlikely to get the financial, material or human resources necessary to make it happen.
2. Ineffective project manager: Project managers who lack the communication and managerial skills needed to move the project ahead pose a serious risk to projects. The authors point out that this is a common risk on IT projects because project managers are often technical folks who have been promoted to managers. As such they may lack the interest, aptitude and/or skills to manage projects. Interestingly, the authors do not comment on the converse problem – whether the project manager’s lack of technical/domain knowledge contributes to project failure.
3. No stakeholder involvement and/or participation: A large number of projects proceed with minimal involvement of key stakeholders. Such folks often lose interest in projects when more immediate matters consume their attention. In such situations a project manager may find it hard to get the resources he or she needs to get the project done. Stakeholder or sponsor apathy is an obvious warning sign that a project is headed for trouble.
4. Uncommitted project team: The commitment (preferably, full-time) of a team is essential for the success of a project. Management needs to ensure that team members are given the time (and incentives) to work on the project. A point that is often left unconsidered is the intrinsic motivation of the team – see this post for a detailed discussion of motivation in project management.
5. Lack of technical knowledge/skills: Project teams need to have the technical skills and knowledge that is relevant to the project. Managers sometimes wrongly assume that project staff can pick up the required skills whilst working on a project. Another common management misconception is that project personnel can master new technologies solely by attending training courses. Getting contractors to do the work is one solution to the problem. However, the best option is to give the team enough time to get familiar with the technology prior to the project or, failing this, to switch to a technology that the team is familiar with.
6. Subject matter experts are not available: It is often assumed that subject matter experts can provide adequate inputs into projects whilst doing their regular jobs. This seldom works – when there’s a choice between the project and their jobs, the latter always wins. Project sponsors need to ensure that subject matter experts are freed up to work on the project.
Process-related early warning signs
1. Unclear scope: The authors label this one as “Lack of documented requirements and/or success criteria.” However I think it is better described by the phrase I’ve used. All project management methodologies emphasise the importance of clear, well-documented requirements and success criteria – and with good reason too. Lack of clarity regarding project scope means that no one knows where the project is headed – a sure sign of trouble ahead.
2. No change control process: As the cliché reminds us, change is the only constant in business environments. It is therefore inevitable that project scope will change. Changes to scope –however minor they may seem- need to be assessed for their impact on the project. The effect of several small (unanalyzed) scope changes on the project schedule should not be underestimated! Many project managers have a hard time pushing back on scope changes foisted on them by senior executives. Hence it is important that the change control process applies across the board – to everyone regardless of their authority.
3. Ineffective scheduling and schedule management: Many schedules are built on little more than guesswork and an unhealthy dose of optimism, often because they are drawn up without input from the folks who’ll actually do the work (see my article on estimation errors for more on this). Schedules need to be rooted in reality. For this to happen, they must be based on reliable estimates, preferably from those responsible for creating the deliverables. Once the schedule is created, it is the project manager’s responsibility to update it continually, reflecting all the detours and road-bumps that have occurred along the way. A common failing is that time overruns are not properly recorded, leading to a false illusion of progress.
4. Communication breakdown: Project communication is the art of getting people on the same page when they are reading different books. In my post on obstacles to project communication, I have discussed some generic difficulties posed by differences in stakeholder backgrounds and world-views. One of the key responsibilities of a project manager is to ensure that everyone on the project has a shared understanding of the project goals and shared commitment to achieving them. This is as true in the middle or the end of a project as it is at the start.
5. Resources assigned to another project: In my experience resources are rarely reassigned wholesale to other projects. What usualy happens is that they are reassigned on a part time basis, as in “we’ll take 20 % of Matt’s time and 10% of Nick’s time.” The problem with this is that Matt and Nick will end up spending most of their time on the other project, leaving the one on hand bereft.
6. No business case: A not uncommon refrain in corporate hallways is, “Why are we doing this project?” No project should be given the go-ahead without a well-articulated business case. Further still, since an understanding reason(s) for doing the project are central to its success, these should be made available to every stakeholder: a shared understanding of the goals of the project is a prerequisite to a shared understanding of the rationale behind it.
I’m sure there aren’t any surprises in this list – most project managers would agree that these are indeed common (and often ignored) early warning signs of failure. However, I suspect that there will be substantial differences of opinion regarding their ranking. Wisely, the authors have refrained from attempting to rank the risks – the list is not in order of importance.
Conclusion
Good projects managers anticipate potential problems and take action to avoid them. Although the risks listed above are indeed obvious , they are often ignored. Affected projects then limp on to oblivion because those responsible failed to react to portents of trouble. Granted, it can be hard to see problems from within the system, particularly when the system is a high-pressure project. That’s where such lists are useful: they can warn the project manager of potential trouble ahead.


